GC原理- 垃圾收集算法
Automatic garbage collection is the process of looking at heap memory, identifying which objects are in use and which are not, and deleting the unused objects. An in use object, or a referenced object, means that some part of your program still maintains a pointer to that object. An unused object, or unreferenced object, is no longer referenced by any part of your program. So the memory used by an unreferenced object can be reclaimed.
- In a programming language like C, allocating and deallocating memory is a manual process. In Java, process of deallocating memory is handled automatically by the garbage collector. The basic process can be described as follows.

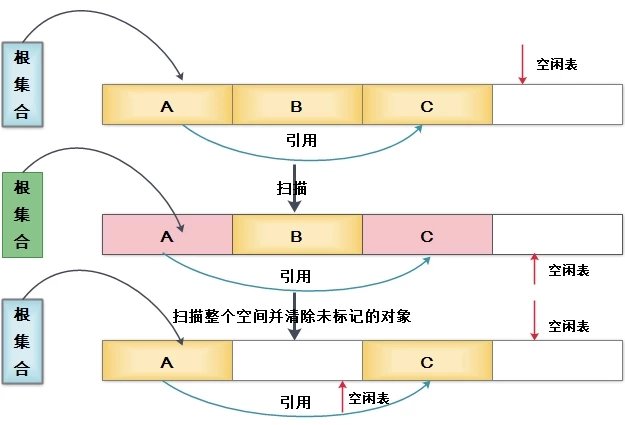
Referenced objects are shown in blue. Unreferenced objects are shown in gold. All objects are scanned in the marking phase to make this determination. This can be a very time consuming process if all objects in a system must be scanned.
Step 2: Normal Deletion
- Normal deletion removes unreferenced objects leaving referenced objects and pointers to free space.
 Step 2a: Deletion with Compacting
- To further improve performance, in addition to deleting unreferenced objects, you can also compact the remaining referenced objects. By moving referenced object together, this makes new memory allocation much easier and faster.

Why Generational Garbage Collection?
As stated earlier, having to mark and compact all the objects in a JVM is inefficient. As more and more objects are allocated, the list of objects grows and grows leading to longer and longer garbage collection time. However, empirical analysis of applications has shown that most objects are short lived.
Here is an example of such data. The Y axis shows the number of bytes allocated and the X access shows the number of bytes allocated over time.

As you can see, fewer and fewer objects remain allocated over time. In fact most objects have a very short life as shown by the higher values on the left side of the graph.
JVM Generations
- The information learned from the object allocation behavior can be used to enhance the performance of the JVM. Therefore, the heap is broken up into smaller parts or generations. The heap parts are: Young Generation, Old or Tenured Generation, and Permanent Generation
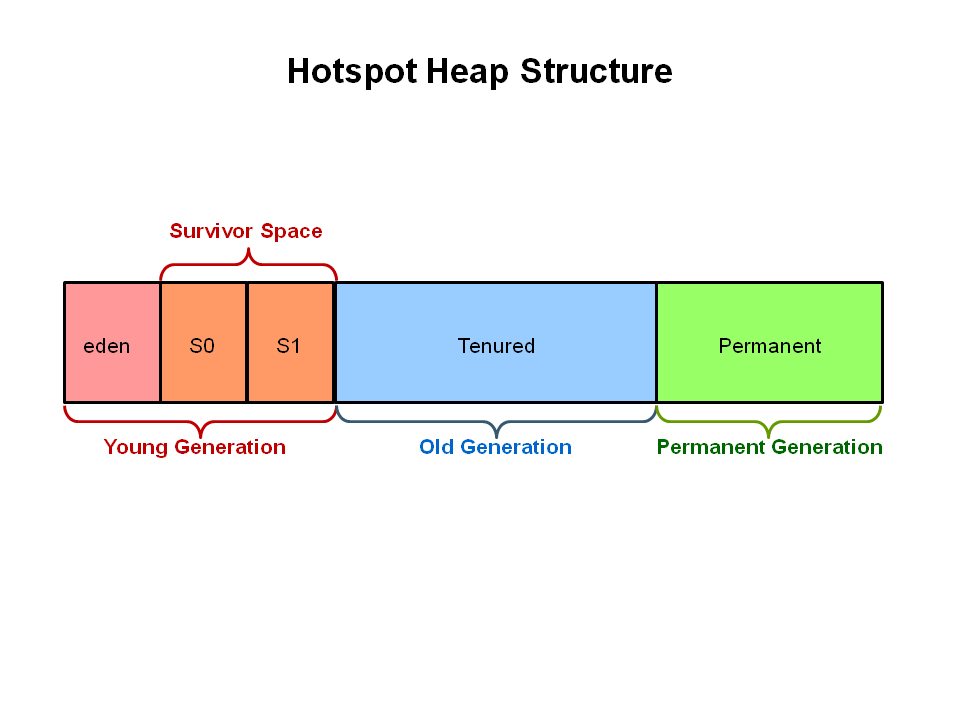
TheYoun g Generationis where all new objects are allocated and aged. When the young generation fills up, this causes aminor garbage collection. Minor collections can be optimized assuming a high object mortality rate. A young generation full of dead objects is collected very quickly. Some surviving objects are aged and eventually move to the old generation.
Stop the World Event- All minor garbage collections are "Stop the World" events. This means that all application threads are stopped until the operation completes. Minor garbage collections are_always_Stop the World events.
TheOld Generationis used to store long surviving objects. Typically, a threshold is set for young generation object and when that age is met, the object gets moved to the old generation. Eventually the old generation needs to be collected. This event is called amajor garbage collection.
Major garbage collection are also Stop the World events. Often a major collection is much slower because it involves all live objects. So for Responsive applications, major garbage collections should be minimized. Also note, that the length of the Stop the World event for a major garbage collection is affected by the kind of garbage collector that is used for the old generation space.
ThePermanent generation metadata required by the JVM to describe the classes and methods used in the application. The permanent generation is populated by the JVM at runtime based on classes in use by the application. In addition, Java SE library classes and methods may be stored here.
Classes may get collected (unloaded) if the JVM finds they are no longer needed and space may be needed for other classes. The permanent generation is included in a full garbage collection.
分代收集算法 VS 分区收集算法
分代收集
当前主流VM垃圾收集都采用”分代收集”(Generational Collection)算法, 这种算法会根据对象存活周期的不同将内存划分为几块, 如JVM中的 新生代、老年代、永久代. 这样就可以根据各年代特点分别采用最适当的GC算法:
在新生代: 每次垃圾收集都能发现大批对象已死, 只有少量存活. 因此选用复制算法, 只需要付出少量存活对象的复制成本就可以完成收集.
在老年代: 因为对象存活率高、没有额外空间对它进行分配担保, 就必须采用“标记—清理”或“标记—整理”算法来进行回收, 不必进行内存复制, 且直接腾出空闲内存.
分区收集
上面介绍的分代收集算法是将对象的生命周期按长短划分为两个部分, 而分区算法则将整个堆空间划分为连续的不同小区间, 每个小区间独立使用, 独立回收. 这样做的好处是可以控制一次回收多少个小区间.
在相同条件下, 堆空间越大, 一次GC耗时就越长, 从而产生的停顿也越长. 为了更好地控制GC产生的停顿时间, 将一块大的内存区域分割为多个小块, 根据目标停顿时间, 每次合理地回收若干个小区间(而不是整个堆), 从而减少一次GC所产生的停顿.
分代收集
新生代-复制算法
该算法的核心是将可用内存按容量划分为大小相等的两块, 每次只用其中一块, 当这一块的内存用完, 就将还存活的对象复制到另外一块上面, 然后把已使用过的内存空间一次清理掉.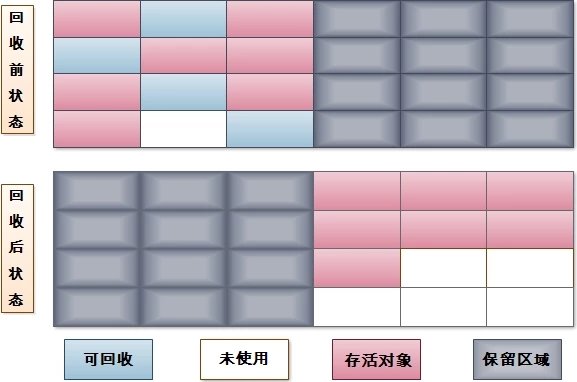
(图片来源: jvm垃圾收集算法)
这使得每次只对其中一块内存进行回收, 分配也就不用考虑内存碎片等复杂情况, 实现简单且运行高效.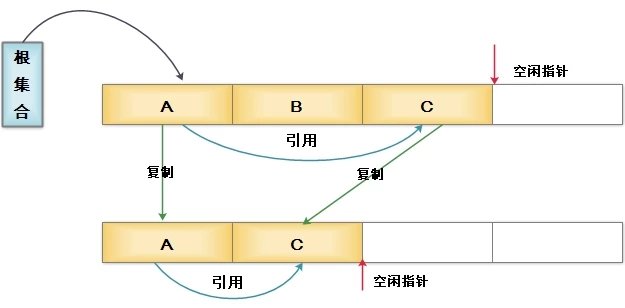
现代商用VM的新生代均采用复制算法, 但由于新生代中的98%的对象都是生存周期极短的, 因此并不需完全按照1∶1的比例划分新生代空间, 而是将新生代划分为一块较大的Eden区和两块较小的Survivor区(HotSpot默认Eden和Survivor的大小比例为8∶1), 每次只用Eden和其中一块Survivor. 当发生MinorGC时, 将Eden和Survivor中还存活着的对象一次性地拷贝到另外一块Survivor上, 最后清理掉Eden和刚才用过的Survivor的空间. 当Survivor空间不够用(不足以保存尚存活的对象)时, 需要依赖老年代进行空间分配担保机制, 这部分内存直接进入老年代.
老年代-标记清除算法
该算法分为“标记”和“清除”两个阶段: 首先标记出所有需要回收的对象(可达性分析), 在标记完成后统一清理掉所有被标记的对象.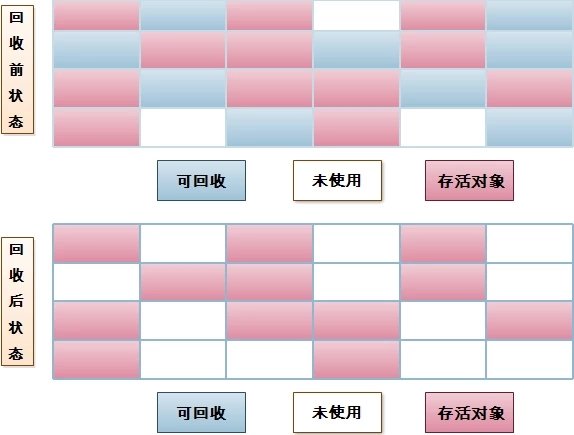
该算法会有以下两个问题:
- 效率问题: 标记和清除过程的效率都不高;
- 空间问题: 标记清除后会产生大量不连续的内存碎片, 空间碎片太多可能会导致在运行过程中需要分配较大对象时无法找到足够的连续内存而不得不提前触发另一次垃圾收集.
老年代-标记整理算法
标记清除算法会产生内存碎片问题, 而复制算法需要有额外的内存担保空间, 于是针对老年代的特点, 又有了标记整理算法. 标记整理算法的标记过程与标记清除算法相同, 但后续步骤不再对可回收对象直接清理, 而是让所有存活的对象都向一端移动,然后清理掉端边界以外的内存.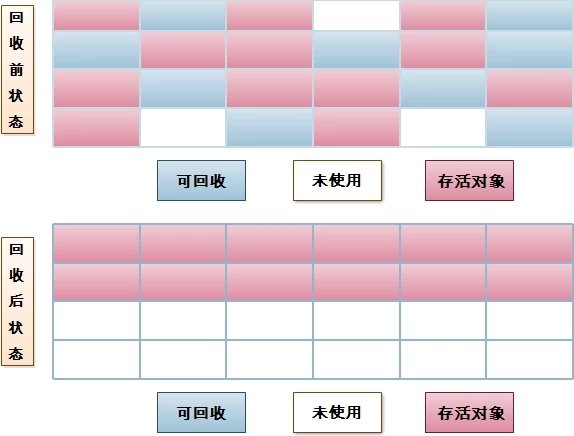
永久代-方法区回收
在方法区进行垃圾回收一般”性价比”较低, 因为在方法区主要回收两部分内容: 废弃常量和无用的类. 回收废弃常量与回收其他年代中的对象类似, 但要判断一个类是否无用则条件相当苛刻:
该类所有的实例都已经被回收, Java堆中不存在该类的任何实例;
该类对应的Class对象没有在任何地方被引用(也就是在任何地方都无法通过反射访问该类的方法);
加载该类的ClassLoader已经被回收.
但即使满足以上条件也未必一定会回收, Hotspot VM还提供了-Xnoclassgc参数控制(关闭CLASS的垃圾回收功能). 因此在大量使用动态代理、CGLib等字节码框架的应用中一定要关闭该选项, 开启VM的类卸载功能, 以保证方法区不会溢出.
Garbage-Collection Roots—The Source of All Object Trees
Every object tree must have one or more root objects. As long as the application can reach those roots, the whole tree is reachable. But when are those root objects considered reachable? Special objects called garbage-collection roots (GC roots; see Figure 2.2) are always reachable and so is any object that has a garbage-collection root at its own root.
There are four kinds of GC roots in Java:
- Local variables are kept alive by the stack of a thread. This is not a real object virtual reference and thus is not visible. For all intents and purposes, local variables are GC roots.
- Active Java threads are always considered live objects and are therefore GC roots. This is especially important for thread local variables.
- Static variables are referenced by their classes. This fact makes them de facto GC roots. Classes themselves can be garbage-collected, which would remove all referenced static variables. This is of special importance when we use application servers, OSGi containers or class loaders in general. We will discuss the related problems in the Problem Patterns section.
- JNI References are Java objects that the native code has created as part of a JNI call. Objects thus created are treated specially because the JVM does not know if it is being referenced by the native code or not. Such objects represent a very special form of GC root, which we will examine in more detail in the Problem Patterns section below.
Figure 2.2: GC roots are objects that are themselves referenced by the JVM and thus keep every other object from being garbage-collected.
Therefore, a simple Java application has the following GC roots:
- Local variables in the main method
- The main thread
- Static variables of the main class
Marking and Sweeping Away Garbage
To determine which objects are no longer in use, the JVM intermittently runs what is very aptly called amark-and-sweep algorithm. As you might intuit, it’s a straightforward, two-step process:
- The algorithm traverses all object references, starting with the GC roots, and marks every object found as alive.
- All of the heap memory that is not occupied by marked objects is reclaimed. It is simply marked as free, essentially swept free of unused objects.
Garbage collection is intended to remove the cause for classic memory leaks: unreachable-but-not-deleted objects in memory. However, this works only for memory leaks in the original sense. It’s possible to have unused objects that are still reachable by an application because the developer simply forgot to dereference them. Such objects cannot be garbage-collected. Even worse, such a logical memory leak cannot be detected by any software (see Figure 2.3). Even the best analysis software can only highlight suspicious objects. We will examine memory leak analysis in the Analyzing the Performance Impact of Memory Utilization and Garbage Collection section, below.